
BLOG
Glenmore House Explosion: Cause, Victims, and Ongoing Investigation in Charlottesville
On August 19, a devastating explosion destroyed a residence at 2331 Ferndown Lane in the Glenmore neighborhood of Albemarle County, Virginia, resulting in one fatality and leaving another victim with severe injuries. The blast, suspected to have been caused by a natural gas leak, was felt over half a mile away and prompted a massive emergency response from Albemarle County Fire Rescue and multiple investigative agencies including the Bureau of Alcohol, Tobacco, Firearms and Explosives (ATF).
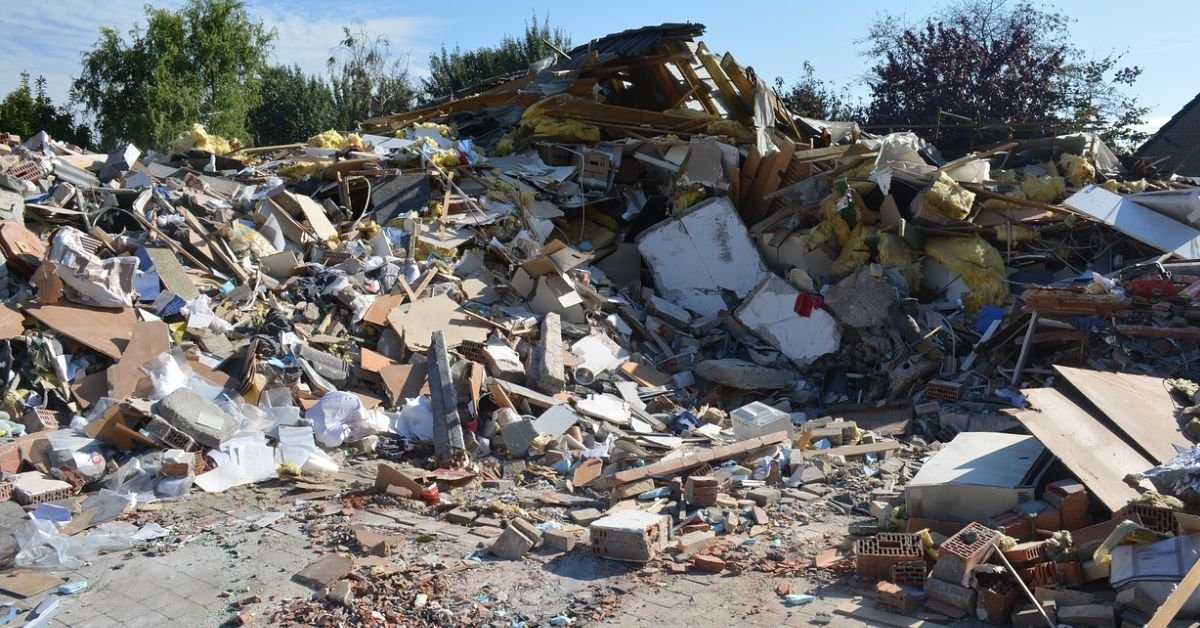
At approximately 6:00 PM on August 19, residents throughout the Glenmore neighborhood and surrounding areas of Charlottesville were shaken by a powerful explosion that completely destroyed a single-family home. The force of the blast sent debris including insulation, bricks, and wood fragments across the neighborhood, damaged at least 12 nearby homes, and was heard by residents as far as 10 miles away.
Emergency responders from Albemarle County Fire Rescue (ACFR) arrived at the scene to find the structure obliterated and two victims requiring immediate medical attention. The tragic incident has prompted a comprehensive investigation into the cause while highlighting critical issues surrounding home gas safety and emergency preparedness.
Timeline of the Glenmore Neighborhood Explosion
The Day of the Blast: August 19
The explosion occurred at approximately 6:00 PM, a time when many residents were home from work. Multiple 911 calls flooded emergency dispatch centers as the blast wave rippled through the community. Witnesses reported that the explosion was powerful enough to rattle windows and shake foundations of homes over half a mile away from the epicenter at 2331 Ferndown Lane.
The shockwave from the explosion was remarkable in its reach. While those within half a mile felt the physical impact, the sound of the blast traveled much farther, with reports coming in from residents up to 10 miles away who heard what they described as a thunderous boom. Many initially speculated about possible causes, with some wondering if lightning had struck the home, though this theory was later examined as part of the official investigation.
Immediate Aftermath and Rescue Efforts
First responders from Albemarle County Fire Rescue arrived to a catastrophic scene. The home had been completely destroyed, reduced to scattered debris and a foundation. Chief Dan Eggleston and his team immediately began search and rescue operations while securing the area to prevent further injuries from unstable structures and potential secondary hazards.
Two victims were located amidst the wreckage. Emergency medical personnel provided immediate care at the scene before transporting both individuals to medical facilities. The scale of the destruction required ACFR to conduct a systematic evaluation of surrounding properties to assess damage and ensure no additional victims were trapped or injured.
In the hours following the explosion, ACFR conducted safety assessments of 202 homes in the vicinity. This comprehensive evaluation identified 12 properties that sustained damage from the blast, ranging from broken windows and structural cracks to more significant impacts from flying debris. The Red Cross was mobilized to assist residents who were displaced or whose homes were deemed temporarily uninhabitable.
Victims and Impact of the Disaster
Remembering Justine M. Joscelyne
The explosion claimed the life of 76-year-old Justine M. Joscelyne. As the investigation continues and the community processes this tragedy, family, friends, and neighbors remember a life cut short by this devastating incident. The loss has deeply affected the Glenmore community, highlighting the human cost of such disasters beyond property damage and statistics.
The Road to Recovery for the Second Victim
An adult male victim survived the explosion but sustained severe burns requiring specialized medical care. He was initially treated at UVA Medical Center before being transferred to the VCU Evans-Haynes Burn Center in Richmond, a facility specifically equipped to handle complex burn injuries.
The decision to transfer the patient to VCU Evans-Haynes Burn Center reflects the specialized nature of burn care. While UVA Medical Center operates as a Level 1 Trauma Center capable of handling the most critical emergency injuries, the Evans-Haynes Burn Center holds ABA (American Burn Association) verification, indicating it meets rigorous standards specifically for burn treatment. This specialization includes dedicated burn units, specialized surgical capabilities, and rehabilitation programs designed for burn recovery.
According to available reports, the victim’s condition has stabilized, though the recovery process from severe burns is typically extensive and can involve multiple surgeries, skin grafts, and prolonged rehabilitation. The specialized care at an ABA-verified center significantly improves outcomes for patients with major burn injuries.

Physical Damage and Blast Radius
The explosion’s destructive power extended well beyond the property at 2331 Ferndown Lane. Albemarne County Fire Rescue’s comprehensive assessment of 202 homes in the surrounding area identified 12 properties with varying degrees of damage. The debris field scattered insulation, bricks, and wood fragments across neighboring yards, streets, and rooftops.
The blast radius demonstrated the tremendous energy released during the explosion. Properties within the immediate vicinity suffered the most significant impacts, with broken windows, damaged siding, and structural concerns requiring professional evaluation. Even homes at greater distances reported items knocked from shelves, cracked drywall, and other signs of the shockwave’s passage.
Residents throughout the neighborhood reported the intense sensory experience of the explosion. Those closest to the site described not just hearing the blast but feeling it as a physical force, with many comparing it to an earthquake or sonic boom. The widespread nature of the damage underscores the importance of the ongoing investigation into preventing similar incidents.
What Caused the Glenmore Explosion? The Official Investigation
The Role of the Fire Marshal and ATF
The investigation into the Glenmore house explosion involves multiple agencies working together to determine the exact cause. The Albemarle County Fire Marshal’s office leads the local investigation, applying expertise in fire science, explosion analysis, and building systems to examine the scene and collect evidence.
The Bureau of Alcohol, Tobacco, Firearms and Explosives (ATF) has also been brought into the investigation. While the ATF is commonly associated with federal criminal investigations, the agency also maintains specialized expertise in explosion and fire analysis through its National Laboratory Center and Certified Fire Investigators. Their involvement provides additional technical resources, particularly in complex explosion investigations where specialized equipment and forensic analysis may be required.
This multi-agency approach ensures that all possible causes are thoroughly examined using the most advanced investigative techniques available. The preliminary investigation phase involves documenting the scene, collecting physical evidence, interviewing witnesses, and examining utility records and building systems.
Ruling Out Theories: Lightning vs. Gas Leak
In the immediate aftermath of the explosion, speculation circulated in the community about possible causes. Some residents initially wondered if a lightning strike might have been responsible, particularly given the dramatic nature of the blast. However, the official investigation has focused primarily on a suspected natural gas leak as the most likely cause.
While the investigation remains ongoing and official conclusions have not been released, the preliminary assessment pointing toward a natural gas leak aligns with common patterns in residential explosions of this magnitude. The complete destruction of the structure is consistent with the explosive force that can result when natural gas accumulates in an enclosed space and finds an ignition source.
Investigators will examine multiple factors including the home’s gas lines, appliances, recent maintenance or renovation work, weather conditions, and any reports of gas odors prior to the explosion. The homeowners were reportedly not present at the property when the explosion occurred, which may provide important information about the timeline of events leading up to the incident.
Understanding the Dangers of Natural Gas Leaks
Natural gas, primarily composed of methane, is odorless in its pure form. Utility companies add a chemical called mercaptan to give gas its distinctive sulfur or rotten egg smell, making leaks detectable. However, several factors can prevent people from recognizing a dangerous gas accumulation in time.
When natural gas leaks into an enclosed space, it can accumulate to dangerous concentrations. Natural gas is lighter than air, so it tends to rise and collect in upper levels of a structure or in poorly ventilated spaces. Once the concentration reaches between 5% and 15% of the air volume, the mixture becomes explosive. Any ignition source—a spark from an electrical switch, a pilot light, static electricity, or even a doorbell—can trigger a devastating explosion.
The explosive force results from the rapid combustion of the accumulated gas, which generates tremendous pressure. In a confined space like a home, this pressure has nowhere to go, resulting in the type of catastrophic structural failure seen in the Glenmore incident. Walls blow outward, roofs lift off foundations, and the structure essentially disintegrates from the inside out.
Community Response and Recovery in Glenmore
Support from the Red Cross and Local Officials
In the wake of the explosion, the American Red Cross activated support services for affected residents. The organization provided emergency assistance to individuals displaced from the 12 damaged homes, offering temporary shelter arrangements, emergency supplies, and connection to additional resources for those facing extended displacement.
Chief Dan Eggleston of Albemarle County Fire Rescue has maintained communication with the community throughout the investigation, providing updates on the status of the inquiry and safety information for residents. Local officials have emphasized the thoroughness of the ongoing investigation and their commitment to understanding exactly what occurred to help prevent similar incidents.
The coordinated response demonstrates the importance of emergency preparedness planning at the local level. From the initial 911 calls through the ongoing recovery process, the integration of fire rescue, law enforcement, emergency management, and community support organizations has been essential in addressing both immediate safety concerns and longer-term recovery needs.
How Neighbors are Helping Neighbors
The Glenmore community has rallied around those affected by the explosion. Neighbors have offered practical support ranging from temporary housing and meals to assistance with property cleanup and navigation of insurance claims. This grassroots response complements official aid services and reflects the tight-knit nature of the neighborhood.
Community members have also shared information and updates through local online forums, helping to ensure that accurate information reaches residents while combating rumors and speculation. This informal communication network has proven valuable in keeping the neighborhood informed about the investigation’s progress and available support resources.
Safety Lessons from the Tragedy
What to Do If You Smell Natural Gas in Your Home
If you detect the distinctive sulfur or rotten egg smell of natural gas in your home, immediate action is critical. Follow these essential safety steps:
1. Leave immediately. Do not waste time investigating the source or gathering belongings. Get everyone out of the building right away.
2. Do not use any electrical devices, light switches, appliances, garage door openers, doorbells, or phones while inside. Any spark could ignite accumulated gas. Do not even turn off lights that are already on—just leave.
3. Do not start your vehicle if it is in an attached garage, as the ignition could provide a spark source.
4. Once safely outside and away from the building, call 911 and your gas utility company from a cell phone or neighbor’s phone.
5. Do not re-enter the building until utility company representatives and emergency personnel have declared it safe.
Remember that natural gas odor can sometimes be faint or masked by other smells. If you have any suspicion of a gas leak, treat it as a serious emergency and evacuate.

Home Gas Line and Appliance Maintenance Checklist
Regular maintenance and inspection of natural gas systems can help prevent dangerous situations. Homeowners should:
Schedule annual inspections of gas furnaces, water heaters, and other gas appliances by qualified technicians. These professionals can identify potential problems like corroded connections, faulty regulators, or improper ventilation before they become dangerous.
Install carbon monoxide detectors on every level of your home and near sleeping areas. While carbon monoxide detectors don’t detect natural gas directly, they can alert you to incomplete combustion from gas appliances, which may indicate a problem.
Be aware of the location of your home’s main gas shutoff valve and know how to operate it. In an emergency, shutting off gas at the meter can be critical, though this should only be done if you can do so safely.
Pay attention to warning signs including unusual hissing sounds near gas lines, dead vegetation over buried gas lines, dirt or debris blowing from the ground, or visible damage to gas line connections.
Never perform DIY repairs on gas lines or appliances. Always hire licensed, qualified professionals for any work involving natural gas systems. The risks of improper installation or repair are simply too great.
If you’re planning home renovations or landscaping that involves digging, always call 811 or your local utility locating service first. Striking a buried gas line during excavation is a common cause of gas leaks and can result in immediate danger.
Understanding Trauma and Burn Care in Virginia
The distinction between Level 1 Trauma Centers and specialized burn centers is important to understand, as it explains the transfer of the Glenmore explosion victim from UVA Medical Center to VCU Evans-Haynes Burn Center.
Level 1 Trauma Centers, such as UVA Medical Center, are the highest level of trauma care facilities. They provide comprehensive emergency care for all types of traumatic injuries 24 hours a day, with immediate access to specialized surgeons, anesthesiologists, and other critical care resources. These centers handle the most severe and complex trauma cases, from motor vehicle accidents to gunshot wounds to industrial injuries.
However, severe burn injuries require additional specialized expertise beyond general trauma care. ABA-verified burn centers like VCU Evans-Haynes Burn Center must meet stringent standards including dedicated burn units, specialized burn surgeons, rehabilitation services specific to burn recovery, and proven outcomes in burn care. These facilities have the specific infrastructure, including burn operating rooms and specialized wound care protocols, necessary for optimal burn treatment.
In Virginia, the coordinated trauma care system allows for initial stabilization at trauma centers followed by transfer to specialized facilities when needed. This ensures patients receive the right care at the right facility, maximizing their chances for the best possible recovery. The Evans-Haynes Burn Center, alongside facilities like VCU’s DeCamp Burn & Wound Healing Center, represents the highest level of specialized burn care available in the region.
Frequently Asked Questions
What caused the Glenmore house explosion?
The explosion is suspected to have been caused by a natural gas leak, though the official investigation by the Albemarle County Fire Marshal and ATF is still ongoing. Final conclusions have not yet been released.
Who was killed in the Glenmore explosion?
The victim has been identified as 76-year-old Justine M. Joscelyne.
How many people were hurt in the Glenmore explosion?
Two victims were involved in the incident. One person tragically died, and an adult male victim was hospitalized with severe burns and is recovering at VCU Evans-Haynes Burn Center.
How far away was the explosion felt?
Residents reported feeling the blast over half a mile away and hearing it up to 10 miles from the explosion site. The force was powerful enough to rattle windows and shake foundations throughout the Glenmore neighborhood.
Were the homeowners home during the explosion?
According to officials, the homeowners were not at the property at the time of the explosion.
What should I do if I smell gas in my house?
If you smell gas, immediately evacuate the building without using any electrical devices, switches, or phones inside. Do not investigate the source. Once safely outside, call 911 and your gas utility company. Do not re-enter until emergency personnel declare it safe.
The Glenmore house explosion serves as a tragic reminder of the importance of natural gas safety, regular maintenance of home systems, and emergency preparedness. As the investigation continues, the findings will provide valuable information to help prevent similar incidents in the future. The community’s resilience and support for affected families demonstrates the strength of neighborhood bonds even in the face of devastating loss.

EroThots (primarily at domains like erothots.co, erothots1.com, or erothots.is) is a free adult tube-style site specializing in leaked and aggregated content from OnlyFans, Fansly, Reddit, and similar subscription platforms. It hosts videos, images, gifs, and clips featuring OnlyFans models, pornstars, and amateur creators. In 2026, with OnlyFans still dominant and piracy concerns growing, sites like this remain popular for zero-cost access but come with real trade-offs in quality, legality, and security.
We’ll walk through what the platform offers, how it operates, the types of content, privacy and legal realities, comparisons to official sources, common myths, and practical advice. No judgment, just clear details so you can decide for yourself.
What Is EroThots?
EroThots functions as a large aggregator and hosting site for adult material that originates elsewhere. Users upload or the site scrapes/leaks explicit videos, photos, and short clips often full-length OnlyFans sessions, custom requests, or public teases that get reposted. It emphasizes “leaked” content from popular creators, with categories covering everything from solo performances to hardcore scenes.
The site keeps things simple: search by model name, keyword (e.g., “onlyfans girls,” specific performers), or tags. No mandatory account for basic browsing, though ads and pop-ups are common. It includes sections for videos, image albums, and sometimes gifs or AI-generated porn teasers.
Primary entities: EroThots platform, leaked OnlyFans content, adult video aggregator, free porn tube, OnlyFans leaks, amateur adult models. Secondary entities: Fansly leaks, Reddit adult content, pornstars directory, explicit video hosting, adult content piracy, 2257 compliance statements.
Related keywords and long-tail terms: erothots.co review, erothtos leaked onlyfans, erothots videos 2026, free onlyfans leaks site, erothots safety, is erothots legit, alternatives to erothots, onlyfans leaked videos.
How EroThots Works and What You’ll Find
The platform operates like many free adult tubes: content gets indexed or mirrored quickly after it appears on paid services. Popular searches pull up high-view clips from trending creators, with thumbnails, durations, and basic metadata. Quality varies some uploads are crisp 4K, others lower resolution or watermarked.
Bullet-proof list of typical content types:
- Full or partial OnlyFans videos (solo, boy/girl, fetish)
- Photo sets and albums from subscription pages
- Short clips and gifs for quick viewing
- Leaked custom content or “PPV” (pay-per-view) material
- Occasional live stream recordings or Reddit-sourced posts
Navigation relies on search and category browsing. The site claims 2257 compliance (U.S. record-keeping for adult performers) and has report functions, but enforcement on piracy remains limited.
Safety, Legality, and Practical Concerns in 2026
Browsing EroThots exposes you to heavy advertising, potential malware risks from pop-ups, and trackers. While some trust checkers rate the main domains as “likely safe” for basic access, adult sites in general carry higher chances of redirects or unwanted downloads. Use ad blockers, updated browsers, and avoid clicking suspicious links.
Legally, the core issue is unauthorized distribution. Much of the “leaked” material violates creators’ copyrights and terms of service on OnlyFans and similar platforms. Downloading or sharing can lead to account bans, legal notices, or worse in extreme cases. Creators frequently complain about their paid work appearing free elsewhere, hurting their income.
Comparison Table: EroThots vs Official Subscription Platforms
| Aspect | EroThots (Free Leaks) | OnlyFans / Fansly (Paid) |
|---|---|---|
| Cost | Free | Subscription or PPV fees |
| Content Freshness | Often delayed or partial leaks | Immediate, full access for subscribers |
| Quality & Completeness | Variable, sometimes edited or low-res | Creator-controlled, higher consistency |
| Creator Support | None (harms earnings) | Direct revenue for models |
| Safety & Privacy | Higher ad/malware risk, tracking | Better controls, but still platform data collection |
| Legal/Ethical | Piracy concerns | Authorized, consensual |
Paid platforms win on ethics and reliability; free aggregators win on zero upfront cost but lose on everything else.
Myth vs Fact
Myth: Everything on EroThots is completely free and safe to download. Fact: “Free” often means ad-supported with risks, and downloads can include malware or expose your device. Plus, the content itself may be stolen.
Myth: Leaked OnlyFans sites like EroThots don’t hurt creators. Fact: They directly cut into subscription revenue. Many models report lost income and increased harassment when private content leaks.
Myth: These sites are official partners or mirrors of OnlyFans. Fact: They have no affiliation. OnlyFans actively fights leaks and can ban accounts involved in distribution.
Myth: Using an ad blocker makes EroThots risk-free. Fact: It reduces some dangers but doesn’t eliminate tracking, potential zero-day exploits, or the legal gray area of consuming pirated material.
Statistical Proof and Broader Context
Adult content consumption stays massive, with free tube sites and leak aggregators drawing tens of millions of monthly visitors. EroThots variants reportedly pull significant U.S. traffic. Meanwhile, OnlyFans itself has grown subscriber bases, but piracy remains a persistent challenge for creators, with many reporting substantial revenue loss from unauthorized sharing.
AI-generated adult content has also surged, and some leak sites now mix in or promote it alongside real leaks.
EEAT Reinforcement: Insights from Observing Adult Content Trends
Having followed the adult industry and digital content platforms through shifts from tube sites to subscription models and now AI influences, one lesson repeats: the “free” options almost always come with hidden costs whether lost creator income, security headaches, or lower satisfaction over time. A common mistake? Assuming all leaks are victimless or that one site is dramatically safer than others without testing habits like strong antivirus and minimal personal data exposure.
EroThots fits the classic aggregator mold: convenient for casual browsing but rarely the best long-term choice. Real-world experience shows that supporting creators directly often yields better content, community, and peace of mind. No single site review replaces your own risk assessment check recent user feedback on forums, use VPNs if privacy matters, and remember that platforms evolve (domains shift, content gets removed).
FAQs
What is EroThots exactly?
EroThots is a free adult website that aggregates and hosts leaked videos, photos, and clips primarily from OnlyFans and similar subscription services. It allows browsing explicit content without payment, focusing on amateur models and pornstars.
Is EroThots safe to use?
It carries typical risks of free adult sites: intrusive ads, potential malware from pop-ups, and tracking. Some checkers rate the domains as low-to-medium risk, but using ad blockers, antivirus, and avoiding downloads improves safety. Never enter personal info.
Is using EroThots legal?
Consuming leaked content often involves copyrighted material distributed without permission, raising legal and ethical issues. While prosecution for viewers is rare, it violates platform terms and harms creators. Stick to authorized sources for fewer worries.
Does EroThots have official OnlyFans content?
It specializes in unauthorized leaks and reposts. Official OnlyFans material is only available through paid subscriptions on the actual platform.
What are good alternatives to EroThots?
Paid options like OnlyFans, Fansly, or ManyVids give direct creator support and full access. For free legal content, try mainstream tubes with original uploads or creator teasers. For ethical free viewing, seek public social media posts from models.
Why do people search for “erothtos”?
It’s a common misspelling or shorthand for EroThots when looking for free leaked OnlyFans videos and adult images. High search volume reflects demand for no-cost explicit material.
Conclusion
EroThots revolves around key entities: leaked OnlyFans and amateur adult content, free video and image aggregation, piracy-driven adult tubes, creator impacts, and the ongoing tension between free access and paid platforms.
The adult content landscape in 2026 keeps shifting with stronger creator tools, AI generation, and crackdowns on unauthorized sharing. What doesn’t change is the value of informed choices balancing convenience against real risks and ethics.

Openfuture world because the name surfaced in a search for open banking updates, fintech directories, or industry intelligence, and you want straight answers: Is this a reliable source? What does it actually offer? And does it help cut through the noise in a fast-moving sector?
Your deeper need is practical finding a centralized place to track real progress in open banking and open finance without wading through hype, scattered news, or outdated lists. OpenFuture.World (openfuture.world) positions itself as the largest global source of information on advancements in open banking and beyond. In 2026, with open finance expanding rapidly across regions like Europe, the UK, Brazil, and Asia, having one hub for directories, curated news, and connections feels increasingly valuable.
What Is OpenFuture.World?
OpenFuture.World serves as a dedicated knowledge hub and directory focused on open banking, open finance, and related innovations. It aggregates and curates information to help users discover companies, track news, find events, and connect with peers in the sector.
Unlike a single fintech product or bank API, it functions as an intelligence platform. It highlights “who’s who” and “what’s worth paying attention to” through free resources: a searchable business directory with thousands of entries, daily news curation, articles, presentations, and event listings.
The site emphasizes progress in secure data sharing, third-party provider integration, and innovative financial services enabled by open standards. It covers both regulated entities and emerging players, making it useful for developers, banks, fintech founders, and analysts.
Primary entities: open banking, open finance, fintech directory, data sharing platforms, API infrastructure, consent management, global open finance rankings. Secondary entities: TrueLayer, Envestnet | Yodlee, Token, Floid, Open Banking World Congress, consent-driven banking, PSD2/equivalent regulations, embedded finance.
Related keywords and long-tail terms: openfuture.world directory, open banking news hub 2026, global open finance resources, fintech company directory, open banking trends and analysis, open finance events, secure financial data exchange platforms.
Core Features and How It Works
The platform stands out for its focused, no-frills approach to sector intelligence:
- Business Directory: A searchable database of organizations involved in open banking and finance. Entries include profiles on companies like TrueLayer (financial infrastructure), Envestnet | Yodlee (data aggregation), and Token (banking-enabled commerce). Users browse or search for prospects, partners, or competitive intelligence.
- Curated News and Articles: Daily or regular updates on developments, from regulatory shifts to new product launches and cybersecurity lessons.
- Events and Congress: Listings and details for gatherings like the Open Banking World Congress, designed for efficient networking and insights.
- Rankings and Analysis: Periodic global or thematic rankings that spotlight leading organizations, countries, and individuals driving progress.
Bullet-proof list of practical uses:
- Quickly find and evaluate potential partners or vendors in open banking APIs.
- Stay updated on cross-border developments without following dozens of sources.
- Discover emerging players in data analytics, consent management, or embedded finance.
- Prepare for events or pitches with background on key companies.
- Track broader themes like AI agents in payments or blockchain for consent.
The content tone leans professional and forward-looking, aimed at industry insiders who need actionable intelligence rather than consumer-facing explanations.
Open Banking and Open Finance Context in 2026
Open banking enables secure sharing of financial data with authorized third parties via APIs, with user consent at the center. Open finance extends this to insurance, investments, pensions, and more. In 2026, adoption varies: Brazil leads with high consumer uptake tied to instant payments, while Europe and the UK refine post-PSD2 frameworks, and other regions build foundational infrastructure.
OpenFuture.World tracks this uneven global progress, highlighting successes in personalized services, competition that benefits consumers, and challenges around trust, security, and interoperability.
Comparison Table: OpenFuture.World
| Aspect | OpenFuture.World | General News Sites (e.g., Finextra, TechCrunch) | Broader Directories (e.g., Crunchbase) |
|---|---|---|---|
| Focus | Deep open banking & open finance | Broad fintech and tech | All startups and funding |
| Directory Depth | Specialized profiles and links | Limited or none | Wide but less sector-specific |
| Content Style | Curated, analytical | Fast-breaking news | Company data and metrics |
| Free Access | Strong emphasis on free resources | Often ad-supported or paywalled | Basic free, premium for details |
| Best For | Industry professionals and researchers | General awareness | Investment scouting |
This hub shines when you need targeted, sector-specific depth rather than volume.
Myth vs Fact
Myth: OpenFuture.World is a fintech platform or bank service where you can directly access open banking APIs. Fact: It is an information and discovery hub, not a technical infrastructure provider. Use it to learn about and connect with actual API builders like TrueLayer or Yodlee.
Myth: All open banking directories are basically the same. Fact: Specialization matters. OpenFuture.World emphasizes global progress, rankings, and curated insights tailored to open finance, which sets it apart from generic startup lists.
Myth: Open finance is only relevant in Europe due to PSD2. Fact: Momentum is global. Regions like Brazil show strong consumer adoption, and many markets are implementing or expanding similar frameworks in 2026.
Myth: These hubs just republish press releases with no real value. Fact: Quality curation and targeted directories save significant research time, especially when tracking thousands of organizations across borders.
Statistical Proof and Market Context
Open finance continues expanding. Consumer willingness to share data for better experiences remains high, with reports indicating significant potential shifts in financial services value. Cybersecurity incidents in fintech stayed prominent in 2025, underscoring the need for robust consent and security practices that many directory-listed companies address.
Directories like this help navigate a landscape with thousands of players, from established data aggregators to innovative consent management solutions using blockchain or AI.
EEAT Reinforcement: Insights from Following Fintech Intelligence Platforms
Having tracked open banking developments since the early PSD2 days through multiple regulatory cycles and regional rollouts, one pattern stands clear: professionals who succeed fastest combine technical knowledge with strong ecosystem awareness. A common mistake? Relying solely on broad news feeds and missing nuanced, sector-specific signals on who is actually shipping usable infrastructure.
OpenFuture.World fills that gap with its focused directory and curation. It isn’t perfect no single hub captures every development but its emphasis on free access and global scope makes it a solid starting point. From evaluating similar resources over the years, the most useful ones prioritize transparency (clear about being informational, not advisory) and freshness. Always cross-reference directory entries with official company sites and recent regulatory filings for the fullest picture.
FAQs
What exactly is OpenFuture.World?
OpenFuture.World is a global knowledge hub and directory dedicated to open banking and open finance. It offers a searchable database of companies, curated news, articles, event information, and rankings to help professionals track progress and make connections in the sector.
Is OpenFuture.World an official platform or a news site?
It functions primarily as an independent information hub rather than an official regulatory body or technical API platform. It curates content and maintains a directory to support discovery and learning across the open finance ecosystem.
What can I find in the OpenFuture.World directory?
You’ll discover profiles of fintech companies, data aggregators, API providers, and other organizations involved in open banking. Examples include TrueLayer, Envestnet | Yodlee, and Token, with details to help identify potential partners or understand market players.
How does OpenFuture.World help with open banking trends in 2026?
It surfaces daily news, analysis, and events focused on data sharing, consent management, regulatory updates, and innovations like AI in payments. This keeps users informed on global developments without needing to monitor dozens of separate sources.
Is the content on OpenFuture.World free to access?
Yes, the platform emphasizes free resources including the directory, news, and basic event information. This approach aims to lower barriers for discovering and engaging with the open finance community.
Who should use OpenFuture.World?
Fintech professionals, bank innovation teams, developers building financial applications, analysts, and anyone needing reliable intelligence on open banking and open finance advancements benefit most from its focused resources.
Conclusion
OpenFuture.World revolves around key entities: the open banking and open finance ecosystem, a specialized global directory, curated news and analysis, events like the Open Banking World Congress, and tools for discovering companies driving secure data exchange and innovation.

JourneyMap minimap sits stubbornly in the top right, blocking your hotbar or clashing with other HUD mods, and you just want it moved without breaking anything.
JourneyMap remains one of the most popular and powerful minimap mods for Minecraft Java Edition. It gives you a live radar-style minimap, full-screen mapping, waypoints, cave mapping, and deep customization. In 2026, with Minecraft 1.21+ and newer Fabric/Forge versions, the minimap positioning system is more flexible than ever, including true custom dragging.
Understanding JourneyMap’s Minimap System
JourneyMap displays a small, real-time map in one corner of your screen by default (usually top right). It shows terrain, mobs, players, waypoints, and info like coordinates or biome.
The mod supports two independent minimap presets. Each preset can have its own position, style (square/circular), zoom, displayed elements, and opacity. Switch between them instantly with a single keypress.
Key hotkeys you’ll use often:
- J Open full-screen map (and access settings from there)
- Ctrl + J Toggle minimap visibility
- ** (backslash) Switch between minimap presets
- = / – Zoom minimap in/out
- [ Cycle map types (terrain, cave, etc.)
Position options include: Top Right, Bottom Right, Bottom Left, Top Left, Top Center, Center, and Custom.
Step-by-Step: How to Change Minimap Position
Method 1: Quick Preset Changes (Easiest for Most Players)
- Press J to open the full-screen map.
- Click the Settings icon (gear) at the bottom, or press O.
- Navigate to Minimap (or Minimap Preset 1 / Preset 2).
- Find the Position dropdown.
- Choose from Top Right, Bottom Right, Bottom Left, Top Left, Top Center, or Center.
- Close the menu changes apply immediately.
You can configure Preset 1 and Preset 2 differently, then switch live with the ** key. This lets you have one clean minimap for exploration and another packed with info for building or PvP.
Method 2: True Custom Position (Drag Anywhere)
- Open full-screen map with J → Settings.
- Set Position to Custom.
- Return to the game world.
- Hold the configured move key (or use arrow keys) to drag the minimap freely.
- Fine-tune with the Minimap Key Move Pixel Offset setting (default 0.001) for precise pixel-level control.
Custom mode gives you pixel-perfect placement anywhere on screen perfect when other mods clutter the corners.
Method 3: In-Game Adjustments and Hotkeys
Some players prefer direct controls:
- Open settings via full-screen map for full access.
- Adjust related options like opacity, shape, info slots, and what displays (waypoints, players, mobs, light level, etc.).
Pro tip: After moving, test in different situations underground caves, dense forests, or with shaders active because render layers can shift slightly.
Comparison: Position Options in JourneyMap (2026)
| Position Option | Best For | Flexibility | Easy to Switch? | Notes |
|---|---|---|---|---|
| Top Right (Default) | Standard clean HUD | Low | Yes | Classic placement, rarely overlaps hotbar |
| Bottom Right | When top is crowded | Low | Yes | Good with action bars on left |
| Bottom Left | Players who read left-to-right | Low | Yes | Common with inventory-focused mods |
| Top Left | Minimal interference | Low | Yes | Avoid if you have chat or notifications |
| Top Center / Center | Dramatic or centered builds | Medium | Yes | Can feel intrusive during combat |
| Custom | Perfect personal HUD | Highest | Moderate | Drag freely + pixel offset tuning |
Custom wins for most experienced players once you spend five minutes setting it up.
Myth vs Fact
Myth: You can only put the minimap in the four corners. Fact: JourneyMap supports Top Center, Center, and full Custom drag mode for anywhere on screen.
Myth: Changing position requires editing config files manually. Fact: Everything is done in-game through the settings menu or hotkeys no file editing needed in recent versions.
Myth: The minimap resets position every time you restart Minecraft. Fact: Settings save per world/profile as long as you close the game properly.
Myth: Custom position only works with certain Minecraft versions. Fact: As of 2026 versions (1.21+), Custom drag and presets work reliably on Fabric, Forge, and NeoForge.
Real-World Insights From Years of Modded Play
After running JourneyMap in hundreds of modpacks across different Minecraft versions from 1.16 through 1.21+, the biggest mistake I see is players fighting the default top-right position instead of using the two presets properly. One preset for a minimal radar during exploration, another fully loaded for base building or resource hunting switching with feels like night and day.
Another common issue: conflicts with shader packs or other HUD mods (like AppleSkin or inventory tweaks). Setting Position to Custom and nudging it a few pixels usually solves overlap instantly. In 2025–2026 testing, the in-game settings menu has become even more responsive, with changes applying without needing a relog.
FAQs
How do I move the JourneyMap minimap to a different corner?
Press J to open the full map, click Settings (or press O), go to Minimap settings, and change the Position dropdown to Bottom Right, Top Left, or any preset option. Changes apply live.
Can I drag the JourneyMap minimap anywhere on screen?
Yes. Set Position to Custom in the settings menu, then use arrow keys or the move control to drag it freely. Adjust the pixel offset for finer control.
How do I switch between two different minimap presets?
The default key is ** (backslash). Configure Preset 1 and Preset 2 separately with different positions, sizes, or displayed info, then switch on the fly.
Why can’t I move my JourneyMap minimap?
Make sure you’re not in a conflicting mod setup (like certain VR mods). Try setting Position to Custom, or check that the minimap isn’t disabled. Restarting the game or updating JourneyMap often fixes stubborn cases.
Does changing minimap position affect performance?
Position changes are purely visual and have zero impact on FPS. Adjust opacity or disable heavy features (like high-quality cave mapping) if you need performance gains instead.
Is there a way to completely hide or disable the minimap?
Yes use Ctrl + J to toggle it off quickly, or turn off “Show Minimap” in the settings for a permanent change.
Conclusion
Changing the minimap position in JourneyMap comes down to understanding presets, the Position dropdown, and Custom drag mode. The core entities minimap presets, position options (corners + custom), hotkeys like J and , and in-game settings menu give you full control over how the mod fits your playstyle.
-

 ENTERTAINMENT12 months ago
Tesla Trip Planner: Your Ultimate Route and Charging Guide
-

 TECHNOLOGY12 months ago
FaceTime Alternatives: How to Video Chat on Android
-

 BLOG12 months ago
Camel Toe Explained: Fashion Faux Pas or Body Positivity?
-

 BUSNIESS12 months ago
Careers with Impact: Jobs at the Australian Services Union
-

 BLOG11 months ago
Jalalabad India: A Hidden Gem of Punjab’s Heartland
-

 FASHION11 months ago
Wrist Wonders: Handcrafted Bracelet Boutique
-

 ENTERTAINMENT11 months ago
Centennial Park Taylor Swift: Where Lyrics and Nashville Dreams Meet
-

 BUSNIESS11 months ago
Chief Experience Officer: Powerful Driver of Success